
If an exception occurs in a program which is being debugged, the system sends the exception firstly to the debugger. This causes the debuggee to enter the debug loop. GoBug intervenes and gives you details of the exception which occurred.
Exceptions caused by the debuggee
How GoBug deals with exceptions
The exception dialog
Intended exceptions
How GoBug deals with exceptions
If an exception occurs in a program which is being debugged, the system
sends the exception firstly to the debugger. This causes the debuggee to enter the debug loop. GoBug intervenes and gives you details of the exception which occurred.
The exception dialog
This modeless dialog shows the exception which has occurred. If it appears you know that the debuggee's action is completely suspended in the debug loop (all threads are suspended).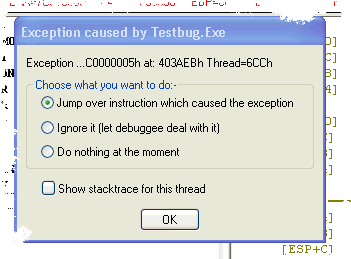
The dialog gives you 3 options:-
If the exception occurred whilst a full log was being made (F5-F7 action or animating) then you can view what led up to the exception in the log.
For more about exception handlers see my paper Except.zip
Intended exceptions
Structured exception handling is sometimes used to provide a signal to the application to perform certain tasks. For example a memory read or write exception may caught by the exception handler if more memory is required. If at the time when such an exception occurs the application is being debugged, the exception will be sent to the debugger first. Windows often uses this method and so during normal operation exceptions can occur within an API. GoBug ignores such exceptions. However when an application uses intentional exceptions, GoBug cannot differentiate between them and errors. In each case the exception dialog will appear, and GoBug will come into the foreground. If the exception is an intentional "signalling" exception it is important that you click the second radiobutton ["Ignore it (let the debuggee deal with it)]. This will allow the debuggee to run normally.